
Step-by-Step Guide: Crafting & Personalizing Your Own Treemap Visualization with Excel

Step-by-Step Guide: Crafting & Personalizing Your Own Treemap Visualization with Excel
Quick Links
If you want to display hierarchical data in a compact visual, you can use a treemap chart. In Microsoft Excel, you can create and customize a treemap in just minutes. We’ll show you how.
About Treemap Charts
As mentioned, treemaps are intended to work with hierarchical data , and this data has one-to-many relationships. Treemaps are a good tool for displaying things like best-selling products, location population, regional sales, and similar parent-child structured data.
Related: How to Create an Organizational Chart in PowerPoint
A treemap uses nested, colored rectangles which you can think of as the branches. Every item in the dataset is represented by a rectangle and the sizes of each correlate to the number data.
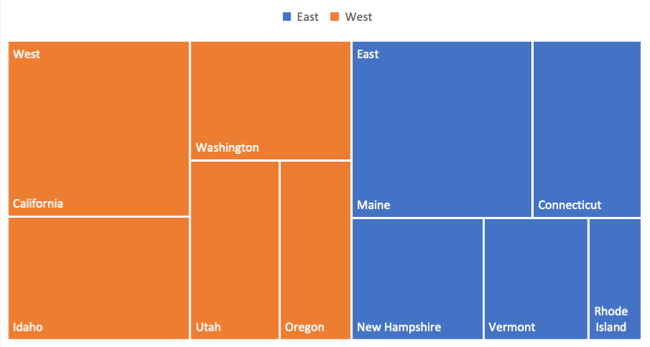
The benefits of a treemap include an easy way to spot patterns, similarities, and anomalies, and a structured method of showing pieces of a whole. The compactness of a treemap also makes it an unobtrusive visual in your spreadsheet.
How to Create a Treemap in Excel
The best way to organize the data for your treemap is to start with the main category or parent in the first column. Then, add the subcategories, subsequent items, and number data in the columns to the right.
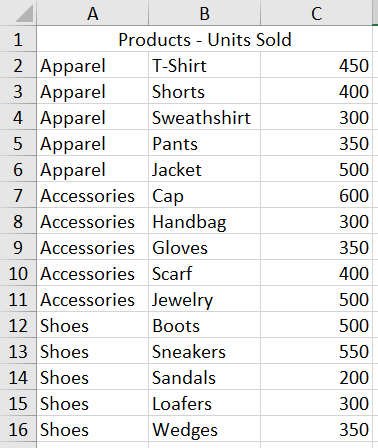
As an example, we’ll use a simple three-column dataset. We have our best-selling products which are categorized by type in the first column. The products within each category are in the second column. And finally, our units sold are in the third column.
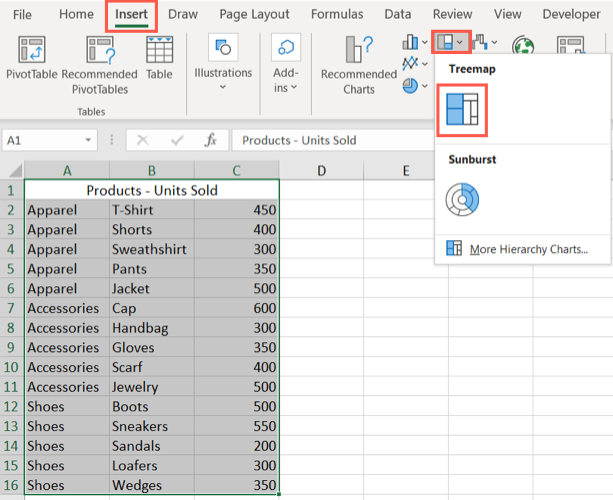
Select the data for the chart and head to the Insert tab. Click the “Hierarchy” drop-down arrow and select “Treemap.”
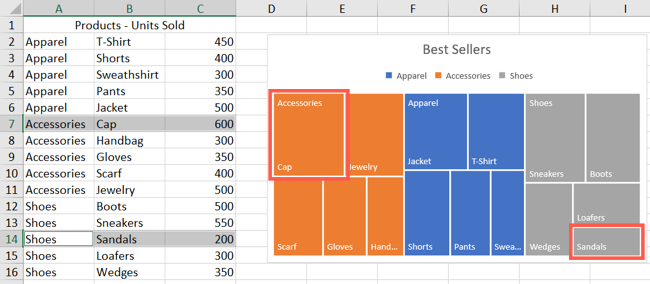
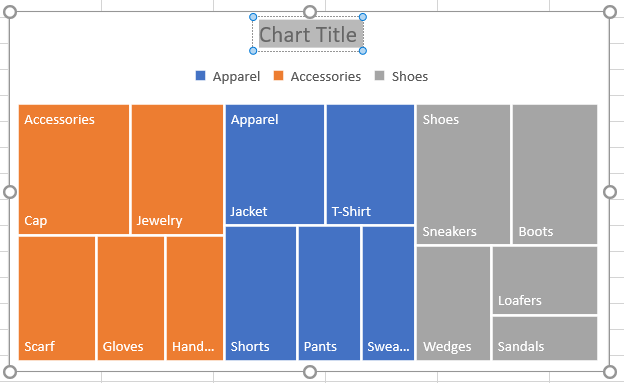
The chart will immediately display in your spreadsheet. And you can see how the rectangles are grouped within their categories along with how the sizes are determined.
In the screenshot below, you can see the largest product sold, Accessories > Cap, and the smallest, Shoes > Sandals.
Next, you can make some changes to the appearance, move or resize the chart, and give it a title.
How to Customize a Treemap in Excel
The best place to start customizing your treemap is by giving it a title. By default, the name is Chart Title. Simply click that text box and enter a new name.
Next, you can select a style, color scheme, or different layout for the treemap. Select the chart and go to the Chart Design tab that displays. Use the variety of tools in the ribbon to customize your treemap.

For fill and line styles and colors, effects like shadow and 3-D, or exact size and proportions, you can use the Format Chart Area sidebar. Either right-click the chart and pick “Format Chart Area” or double-click the chart to open the sidebar.
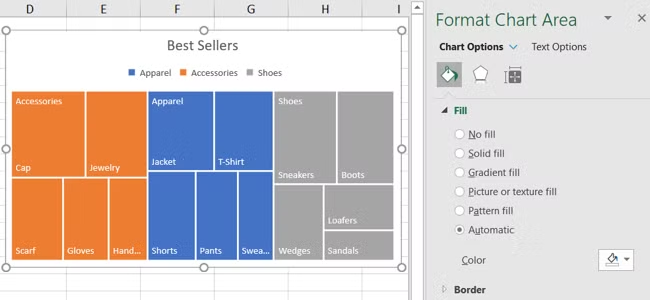
On Windows, you’ll see two handy buttons on the right of your chart when you select it. With these, you can add, remove, and reposition Chart Elements. And you can pick a style or color scheme with the Chart Styles button.

To move your chart to a new spot on your sheet, simply select it, then drag and drop it where you want it. To resize the chart, you can drag inward or outward from a corner or edge.

Charts are super visuals that can help display your data in easy-to-read ways for your audience. So, you might also consider creating a waterfall chart or a Pareto chart in Microsoft Excel.
Also read:
- [New] 2024 Approved Finding the Central Node of YouTube Video Management
- [New] In 2024, Practical Steps to Remove the Cluttered Background in Figma
- [New] Spotify’s Top 10 Chart-Toppers for 2024
- 2024 Approved Leading Speech Gatherers in Educational Environments
- 網路無限制地自由轉換ASF到MP4 - 使用Movavi 轉換工具
- Evolving WinAdmin Roles with Innovative UAC Strategies
- Expert Tips for Efficient Voice Recording on Windows 11
- From Template to Trendsetter Gamer Channel Banners Guide
- Immediate Solutions for Stalled Task Scheduling
- In 2024, Can You Unlock iPhone 6 Plus After Forgetting the Passcode?
- In 2024, How to Transfer Photos from Infinix Zero 5G 2023 Turbo to Laptop Without USB | Dr.fone
- iPogo will be the new iSpoofer On Itel P40+? | Dr.fone
- Master the Art of Show/Hide File Explorer Folders (Windows 11)
- Quick Fixes to Dodge Windows Login Requests
- Recover your music after Tecno Camon 20 has been deleted
- Solving Problematic Video Driving Issues
- Streamlining Task Management with Widgets on Win 11
- Triple Column Widget Setup in Windows 11 Guide
- Unveiling the Obscured: System Tray on Win11
- Title: Step-by-Step Guide: Crafting & Personalizing Your Own Treemap Visualization with Excel
- Author: Richard
- Created at : 2024-12-04 02:08:35
- Updated at : 2024-12-06 22:32:02
- Link: https://win11-tips.techidaily.com/step-by-step-guide-crafting-and-personalizing-your-own-treemap-visualization-with-excel/
- License: This work is licensed under CC BY-NC-SA 4.0.